
Other Mapping Platforms
The Riparian Web Portal interactive map primarily showcases Riparian Intactness data, in addition to Catchment Pressure & Prioritization data layers available with login access in some locations.
This is just one piece of the riparian health puzzle. Other organizations have created mapping tools that contribute to a well-rounded view of riparian health, conditions, and trends. You can also explore data on citizen science platforms, which you can explore here.
Biodiversity Focused
This is an interactive, web-based platform that allows users to visualize patterns of species, habitats, and human footprint across Alberta. Some data layers include wetland inventory and classification, surface water and hydrology features, land cover/vegetation types, intactness and human footprint, and biodiversity indicators such as species richness.


It compiles biodiversity observation data, primarily birds, but also other species like amphibians, reptiles, bats, and some insects; from monitoring, banding, and citizen science programs across Canada.
The data are contributed by citizen scientists and researchers nationwide and viewed through an interactive online platform.
Uses satellite imagery, water samples, and time‑series data (such as chlorophyll‑a concentrations) to map where and when algal blooms occur at a handful of popular lakes in Alberta. It also has links to data to learn more about Cyanobacteria and provincial lake monitoring.

Water Focused

This platform analyzes flood risk by using hydrodynamic models (such as the CaMa‑Flood model) and large public datasets (e.g., climate and runoff data) to produce 1‑km resolution maps, and it is used by the public and decision‑makers to explore current and future flood scenarios and guide planning, preparedness, and further investigation.
THREATS™ (The Healthy River Ecosystem AssessmenT System) is an interactive, web-based platform designed for municipalities, utilities, and watershed managers to assess environmental, water quality, and source water risks. It integrates over 100 datasets, spatial-temporal analytics, and machine learning to enable rapid, evidence-based decision-making. Login access is needed to view the data.


This interactive StoryMap was created by the Alberta Geological Survey (Alberta Energy Regulator) and presents the hydrogeological regions of Alberta, showing how geology, landforms, climate, and sediment influence groundwater movement, availability, and quality across the province. Users can explore the map layers and click on regions to learn about groundwater systems and aquifers.
Uses climate models and interactive maps to show how precipitation is changing over time, including increases in total rainfall in many regions and more frequent extreme precipitation events like heavy downpours that can lead to flooding or drought risk.
It also connects this data to education by offering lesson plans, videos, guidebooks, and classroom activities.


The Alberta Rivers portal provides near real‑time hydrological data, including river flow, water levels, snowpack, and precipitation. The maps show how rainfall and snowmelt contribute to runoff, seasonal flow changes, and risks like flooding or drought across the province.
They monitor river and creek health using chemical and biological water‑quality indicators (e.g., pH, dissolved oxygen, turbidity, temperature, nutrients) to track conditions and changes over time.
Data is collected by trained students and citizen volunteers using portable lab equipment, contributing to long‑term datasets. RiverWatch also offers guided programs.

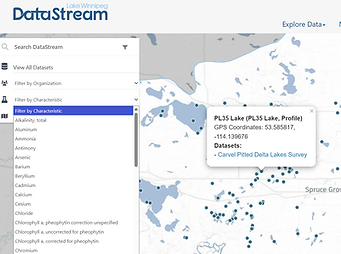
It hosts and standardizes water and sediment quality data (from field observations to lab analyses, across many parameters) to support understanding of freshwater health across Canada.
Data are uploaded by diverse monitoring groups and are made openly accessible and publicly viewable on a shared platform for anyone to explore, download, and use.
It maps and tracks aquatic barriers (e.g., dams, waterfalls, fishways, crossings) across Canada, compiling detailed attributes such as location, structure type, use, size, and fish passage to assess impacts on freshwater connectivity. The data is collected from many existing datasets and sources by the Canadian Wildlife Federation and partners, standardized into a single open national database.


It provides a single, consistent national dataset of surface soil moisture (percent saturation in the top ~5 cm of soil) derived from satellite observations, showing conditions and anomalies (wetter/drier than average).
The data is produced from passive microwave satellite data collected by the Soil Moisture and Ocean Salinity (SMOS) satellite. The data are produced by the European Space Agency. with regular time‑series maps across Canada.